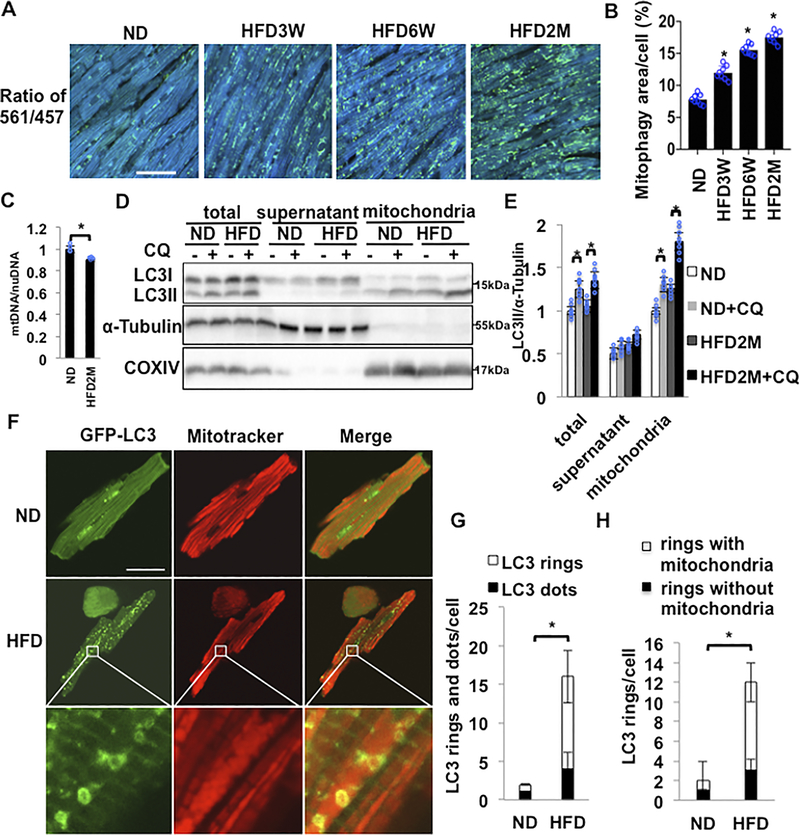
Figure 2. Mitophagy in the heart was upregulated in response to HFD feeding.
(A) Evaluation of mitophagy in cardiac specific Mito-Kiema transgenic mice fed ND or HFD for different durations. Areas with 561/457 nm ratios, indicating mitophagy, are shown. Scale bar = 50μm. (B) Quantification of the mitophagy area at different time points (n=8 in each group. Values are means ± S.E. *, p<0.05 using unpaired Student t test). (C) Relative mitochondrial DNA content normalized by nuclear DNA content was decreased after 2 months of HFD feeding (n=4 in each group. Values are means ± S.E. *, p<0.05 using unpaired Student t test). (D,E) Representative immunoblots and quantitative analyses of whole-cell heart homogenates and isolated mitochondria for LC3II, α-Tubulin and COXIV. Whole-cell heart homogenates, the mitochondrial fraction, and the supernatant fraction were prepared from mice subjected to either ND or HFD feeding for 2 months. (n=8 in each group. Values are means ± S.E. *, p<0.05 using unpaired Student t test). (F-H) Representative fluorescent images and quantitative analyses of adult CMs isolated from cardiac Tg-GFP-LC3 mice subjected to either ND or 2 months of HFD feeding. CMs were incubated with Mitotracker. HFD increased either GFP-LC3 dots or GFP-LC3 rings. Many GFP-LC3 rings were enriched with mitochondria (n=8 in each group. The number of CMs is 50 in each group. Values are means ± S.E. *, p<0.05 using unpaired Student t test). Scale bar = 50 μm.

