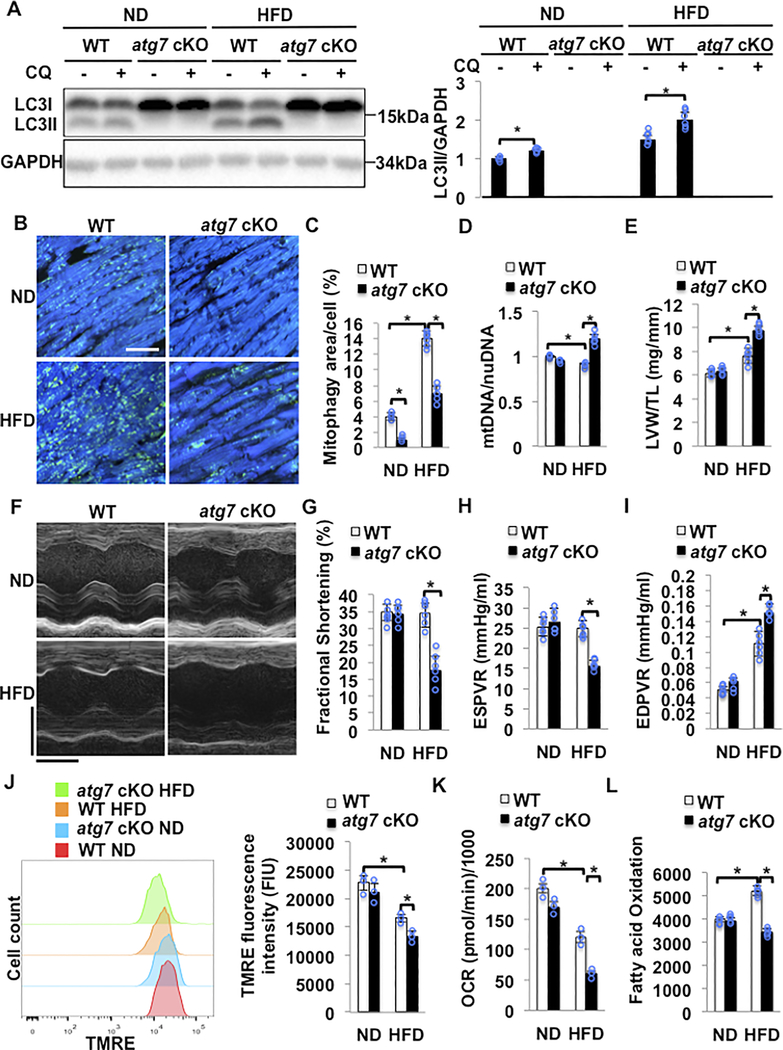
Figure 3. HFD feeding induced cardiac dysfunction in atg7 cKO mice. WT and atg7 cKO mice were subjected to either ND or HFD feeding for 2 months.
(A) Representative immunoblots and quantitative analysis of whole-cell heart homogenates for LC3II in WT and atg7 cKO mice. N=5–6 in each group. Values are means ± S.E. *, p<0.05 using unpaired Student t test. (B,C) Representative fluorescent images and quantitative analyses of mitophagy in Tg-Mito-Keima mice crossed with WT or atg7 cKO mice and fed with either ND or HFD. Scale bar = 50μm. N=5–6 in each group. Values are means ± S.E. *, p<0.05 using one way ANOVA followed by Bonferroni’s post-hoc test. (D) Relative mitochondrial DNA content/nuclear DNA content was greater in atg7 cKO mice with HFD than in WT mice with HFD. N=5–6 in each group. Values are means ± S.E. *, p<0.05 using one way ANOVA followed by Bonferroni’s post-hoc test. (E) Quantitative analyses of LVW/TL. N=5–6 in each group. Values are means ± S.E. *, p<0.05 using one way ANOVA followed by Bonferroni’s post-hoc test. (F). Representative M mode tracing of echocardiographs. Scale bars, horizontal 100 ms and vertical 2 mm. (G) Left ventricular fractional shortening (LVFS) was evaluated by echocardiography. N=5–6 in each group. Values are means ± S.E. *, p<0.05 using one way ANOVA followed by Bonferroni’s post-hoc test. (H) ESPVR evaluated by PV-Loop analysis showed that atg7 cKO mice developed severe cardiac systolic dysfunction following 2 months of HFD feeding. N=5–6 in each group. Values are means ± S.E. *, p<0.05 using one way ANOVA followed by Bonferroni’s post-hoc test. (I) EDPVR evaluated by PV-Loop analysis showed that atg7 cKO mice developed severe cardiac diastolic dysfunction following two months of HFD feeding. N=5–6 in each group. Values are means ± S.E. *, p<0.05 using one way ANOVA followed by Bonferroni’s post-hoc test. (J) Representative results of flow cytometric analyses and quantitative analyses of TMRE intensity in adult CMs isolated from the indicated group, showing that the MMP was decreased in atg7 cKO mice fed with HFD. N=3 in each group. Values are means ± S.E. *, p<0.05 using one way ANOVA followed by Bonferroni’s post-hoc test. (K) Mitochondrial oxygen consumption rate (OCR) in isolated CMs was evaluated with Sea Horse Analyzer. N=3 in each group. Values are means ± S.E. *, p<0.05 using one way ANOVA followed by Bonferroni’s post-hoc test. (L) Fatty acid oxidation was evaluated with [3H]-oleic acid. Increases in fatty acid oxidation in response to HFD feeding were abolished in atg7 cKO mice. N=5 in each group. Values are means ± S.E. *, p<0.05 using one way ANOVA followed by Bonferroni’s post-hoc test.

