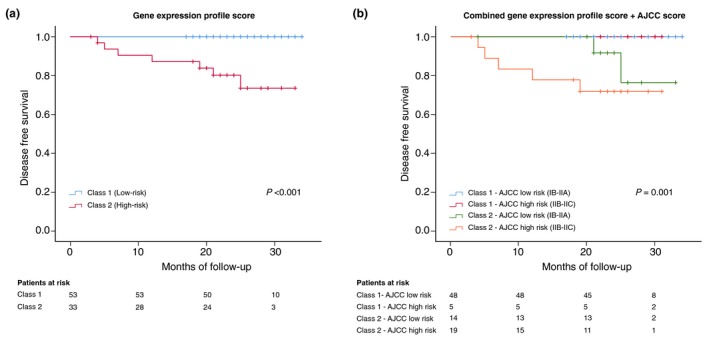
Figure 2.

Kaplan–Meier estimates of disease‐free survival. (a) Kaplan–Meier curve showing disease‐free survival for the two GEP cohorts. (b) displays four subgroups of patients according to the outcomes predicted by the AJCC staging system in combination with gene GEP testing. Survival table is shown at the bottom of each figure. AJCC, American Joint Committee on Cancer.
