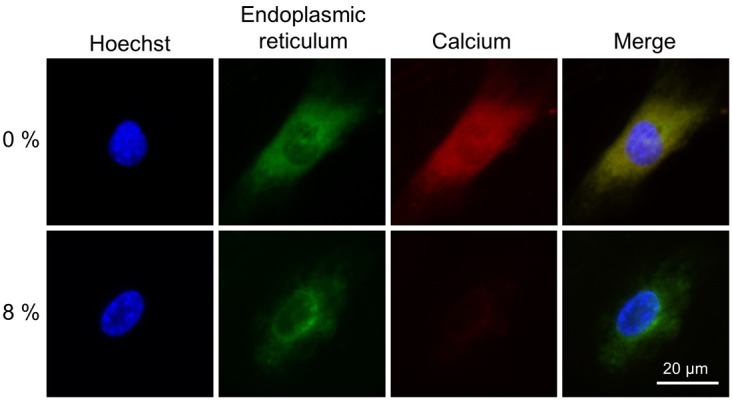
Fig. 2.

Fluorescent staining images of osteoblast endoplasmic reticula and intracellular Ca2+ in MC3T3-E1 cells following stretch stimulation. Endoplasmic reticulum was stained green, Ca2+ was stained red, and cell nuclei were stained blue using Hoechst. A marked decrease in intracellular Ca2+ staining was observed in the cells that underwent 8% stretch stimulation compared with the control cells (0% stretch stimulus).
