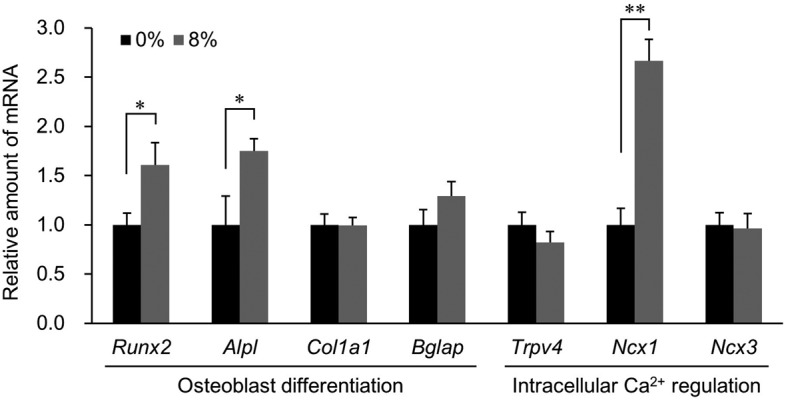
Fig. 3.

Gene expression of osteoblast differentiation markers (Runx2, Alpl, Col1a1, and Bglap) and regulating factors involved in intracellular Ca2+ concentration (Trpv4, Ncx1, and Ncx3) in the undifferentiated MC3T3-E1 cells exposed to 8% stretch stimulus. Each gene expression level was defined as the value obtained from realtime RT-PCR analysis divided by the Gapdh value. The data were analyzed using Student’s t-test. Mean ± SD, n=5, *P<0.05, **P<0.01.
