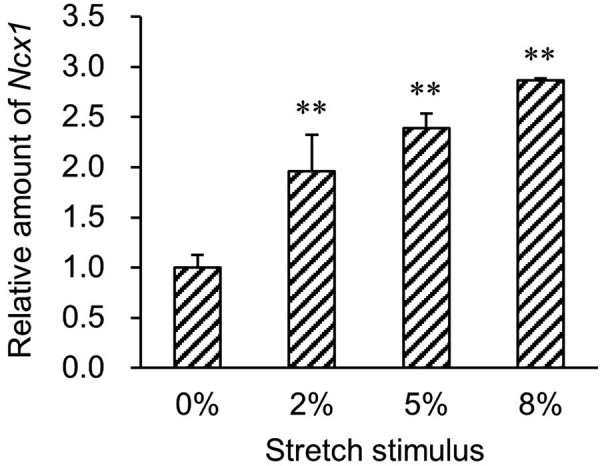
Fig. 4.

Quantitative PCR analysis of Ncx1 mRNA expression in cells after 2, 5, and 8% stretch stimuli. The data were normalized to the Gapdh mRNA level in each sample and are expressed as values relative to the internal control. The measurement values for each group were compared using Bonferroni-Dunn’s post hoc tests. Mean ± SD, n=5, **P<0.01.
