Fig. 3.

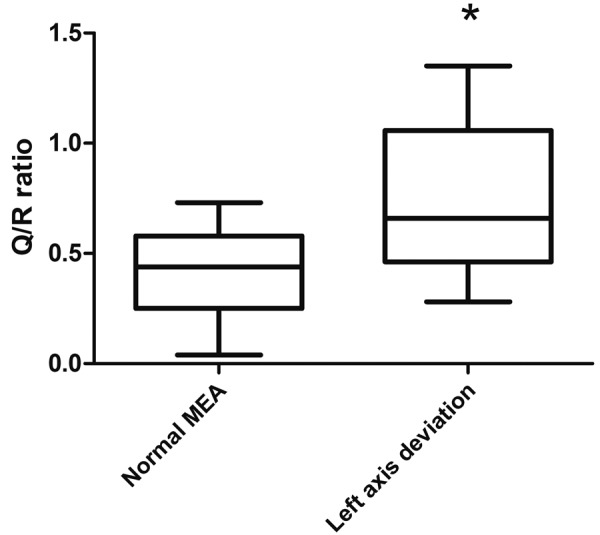
Box and whiskers plot for the Q/R ratio in lead II. Dogs presenting left axis deviation showed a higher Q/R ratio in comparison to dogs having a MEA within reference range (*P<0.001).

Box and whiskers plot for the Q/R ratio in lead II. Dogs presenting left axis deviation showed a higher Q/R ratio in comparison to dogs having a MEA within reference range (*P<0.001).