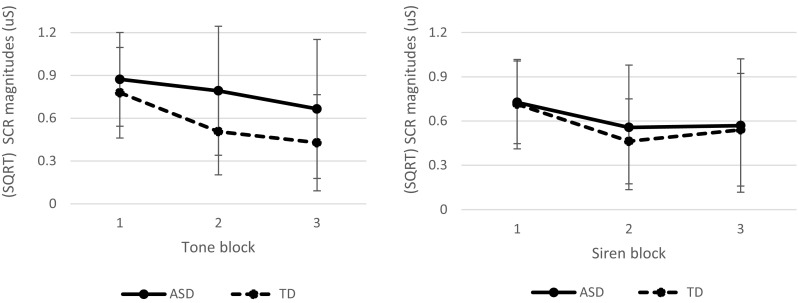
Fig. 2.

Mean (SQRT) SCR magnitude slope for each group and per stimulus: tone (left) and siren (right). Each block contains five repetitions. Both groups showed a decrease in SCR magnitudes in response to both stimuli. The ASD group had a significant higher SCR magnitude overall in response to the tone compared to the TD group
