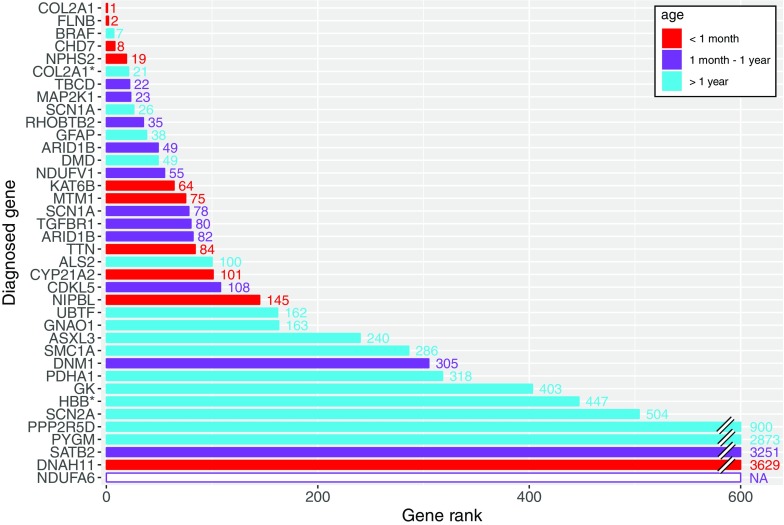
Fig. 3.
Bar chart showing where the diagnosed gene ranked in phenotype similarity score to the proband, compared to all 3926 HPO-typed genes in OMIM. The white bar indicates that the diagnosed gene was only recently reported and not yet HPO-typed. An asterisk (*) indicates that the gene only partially explained the phenotype. Families 111 and 170 are not included because both are large deletions where a specific gene has not been implicated. Red, under 1 month old at recruitment. Purple, 1 month–1 year old at recruitment. Blue, over 1 year old at recruitment

