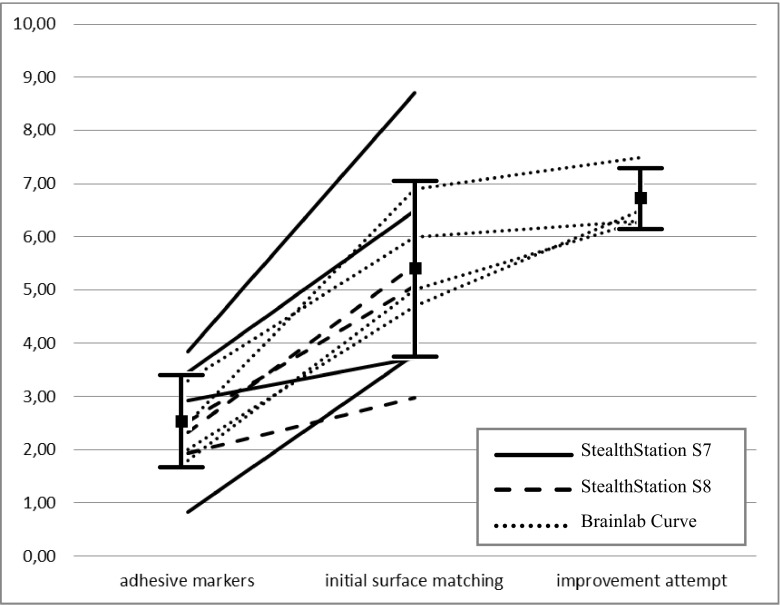
Figure 2.
Graph showing all TRE measurements (in mm) using adhesive markers, surface matching, and a secondary surface matching attempt. The latter was only available in the Curve navigation system. Each line represents different measurements within a single patient. Line styles are explained in the legend. I-bars represent means ± standard deviation

