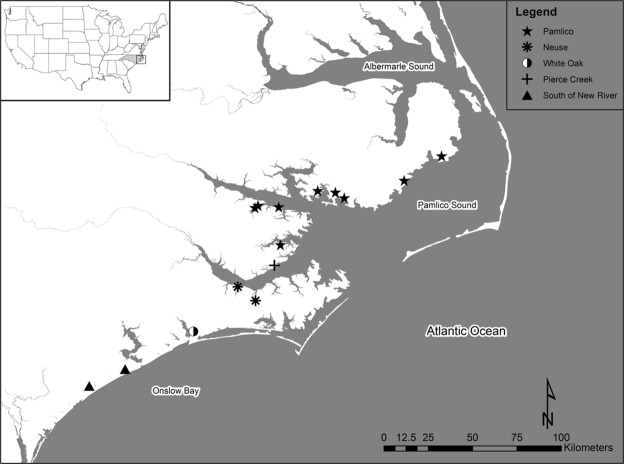
Figure 1.
Map showing the location of temperature probes deployed in North Carolina juvenile southern flounder nursery habitats from 2014 to 2017. Markers indicate the location of a single temperature logger (many additional sampling sites where fish were captured are not shown). Sites were grouped into three regions: (1) Pamlico (stars; northern), (2) Neuse (asterisks; intermediate), (3) South of the New River (triangles; southern). There were temperature loggers at two additional sites, one in Pierce Creek (plus sign) and one in the White Oak River (half circle), where temperature was recorded but the site was not included in any of the three regions. Map was created with Environmental Systems Research Institute, ArcGIS Desktop 10.3.1. (ESRI 2018: Redlands, CA, USA, www.esri.com).

