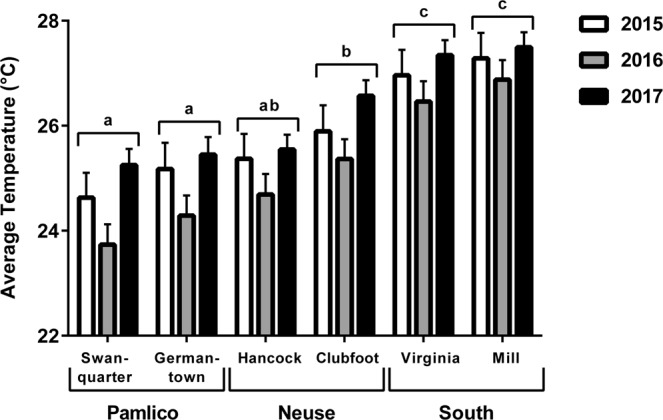
Figure 2.

Average annual water temperature from representative juvenile southern flounder habitats in years 2015, 2016, and 2017 (April 16 to June 30). Temperature was recorded every 2 hours and readings were averaged for each 24-hour period. Letters indicate differences among habitats over the three years taken together (ANOVA, P < 0.0001). With all habitats combined the effect of year was significant for 2016 (ANOVA, *P < 0.0001).
