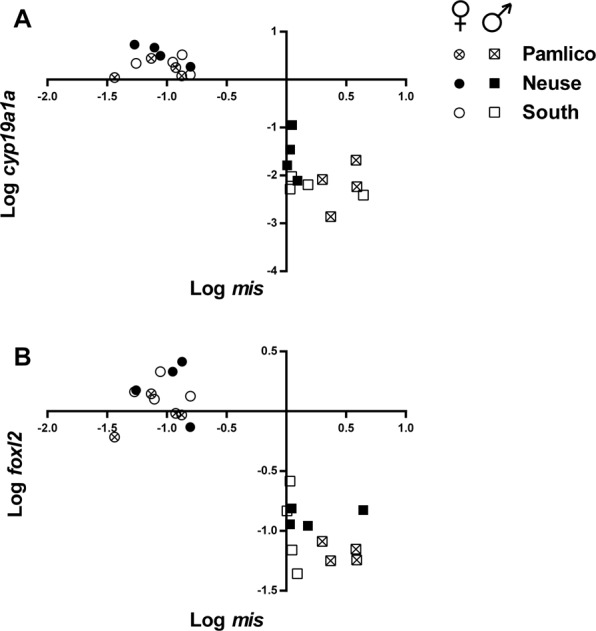
Figure 4.

Mean log-transformed levels of gonadal mRNA of male (mis) and female (foxl2 and cyp19a1a) biomarkers normalized to the reference gene ef-1α and plotted relative to each other from years 2014 to 2017. Shown above are dimorphic gonadal expression patterns for each marker (A) mean log mis as a function of mean log foxl2 (B) mean log mis as a function of mean log cyp19a1a. Females are indicated by circles and males are indicated by squares. Samples from the Pamlico region are shown as circles/squares with an “x”, the Neuse region as black circles/squares, and the South region as white circles/squares.
