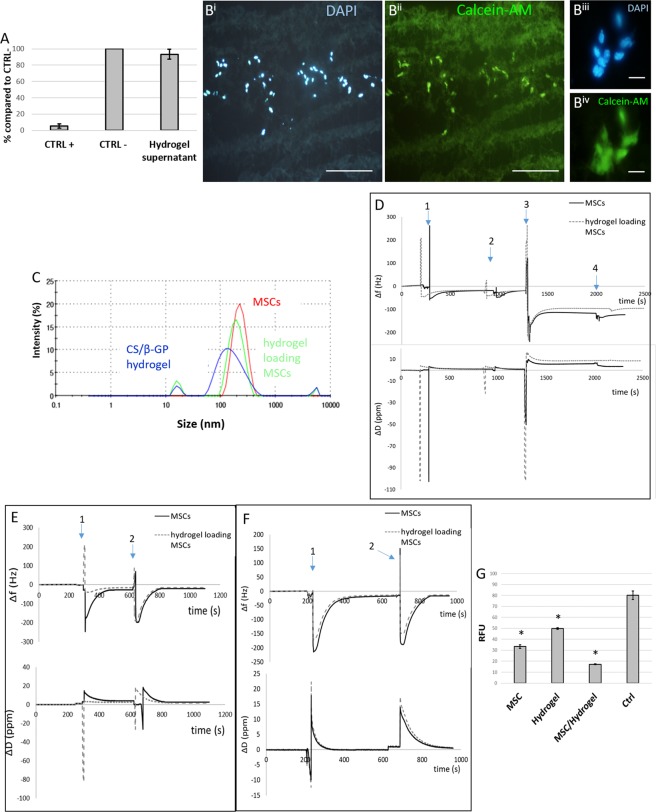
Figure 7.
(A) MTT assay. The percentage of live cells was calculated for CTRL+ and MSC medium + CS, compared to CTRL− conditions. (B) Representative images of cells encapsulated in CS/β-GP hydrogel after 5 days (DAPI-blue and calcein-AM-green staining), at low (Bi-Bii) and high magnification (Biii-Biv). (C) Detection of MVs released by MSC alone or encapsulated into CS/β-GP hydrogel through DLS analysis; (D) QCM-D plot of the seventh overtone of Δf and ΔD versus time using an Au sensor where event 1 was due to PEI solution pouring on AU sensor, event 2 to rinse of PEI coated sensor, event 3 to MV pellet suspended in PBS poured on crystal surface and event 4 to final rinsing step; (E) plot of the seventh overtone of Δf and ΔD versus time using an anti-CD9 coupled sensor where event 1 was due to MV pellet suspended in PBS poured on crystal surface and event 4 to final rinsing step; (F) plot of the seventh overtone of Δf and ΔD versus time using an anti-CD81 coupled sensor where event 1 was due to MV pellet suspended in PBS poured on crystal surface and event 4 to final rinsing step; (G) DCFHA-DA assay: the oxidative stress (expressed as RFU) induced in SH-SY5Y cells by H2O2 is reduced by adding MSC, CS/β-GP and MSC + CS/β-GP supernatant in comparison to CTRL + growth condition. Scale bar: (Bi-Bii) 200 μm, (Biii-Biv) 20 um.

