Figure 1.

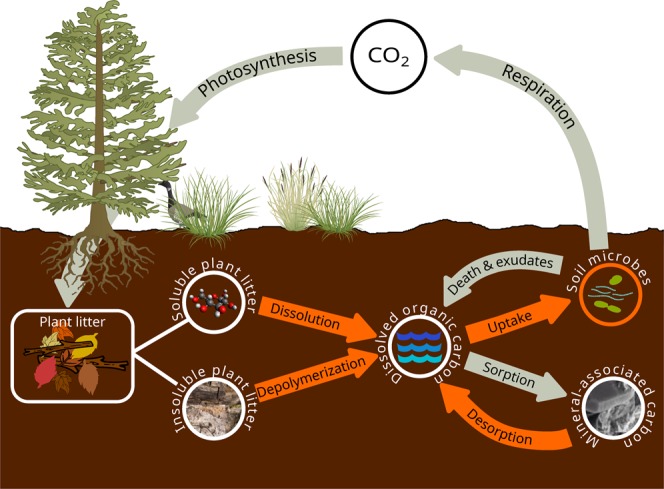
Schematic of microbial soil organic carbon (SOC) model SOMic 1.0. Carbon fluxes between pools are indicated by arrows, with fluxes whose rate constants are mediated by microbial enzyme activity indicated in orange.

Schematic of microbial soil organic carbon (SOC) model SOMic 1.0. Carbon fluxes between pools are indicated by arrows, with fluxes whose rate constants are mediated by microbial enzyme activity indicated in orange.