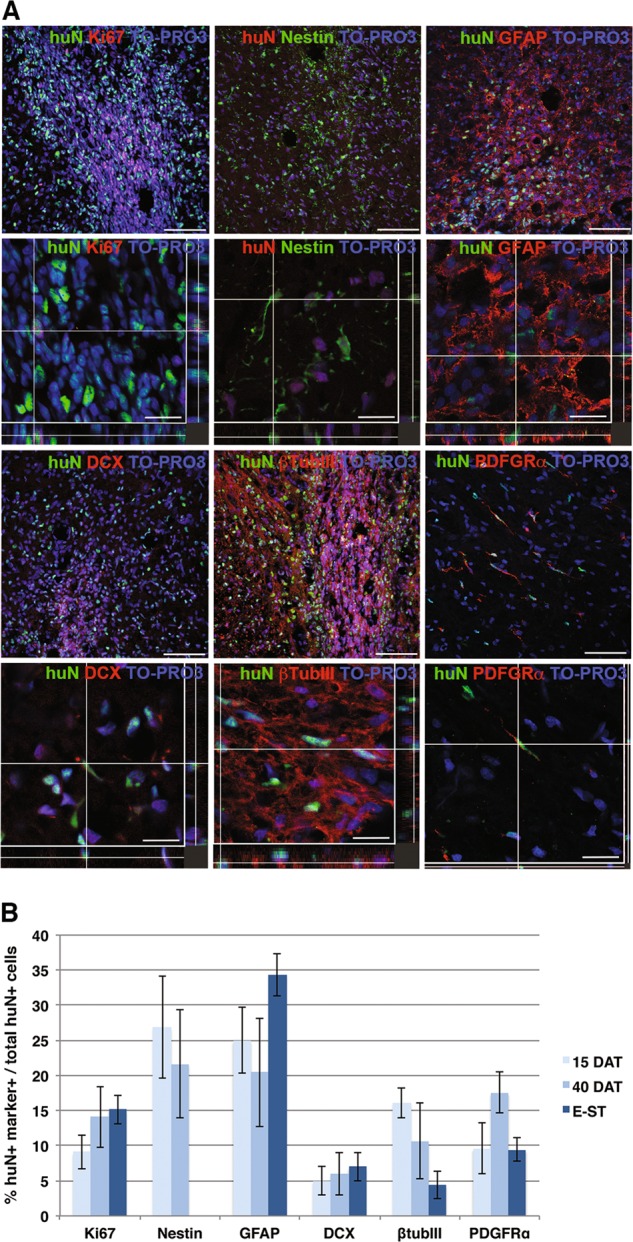
Fig. 2. Differentiation of transplanted hNSCs within the SOD1 rat spinal cord.

a Representative confocal images showing the colocalization of the human nuclear antigen (huN) with proliferating cells (Ki67) and neural phenotype markers (Nestin, GFAP, DCX, btubIII and PDGFR-a) in transplanted hNSCs at 40DAT. b Quantification of each markers. Scale bars: 75 μm for the maximum projection images and 15–25 μm for the colocalization images
