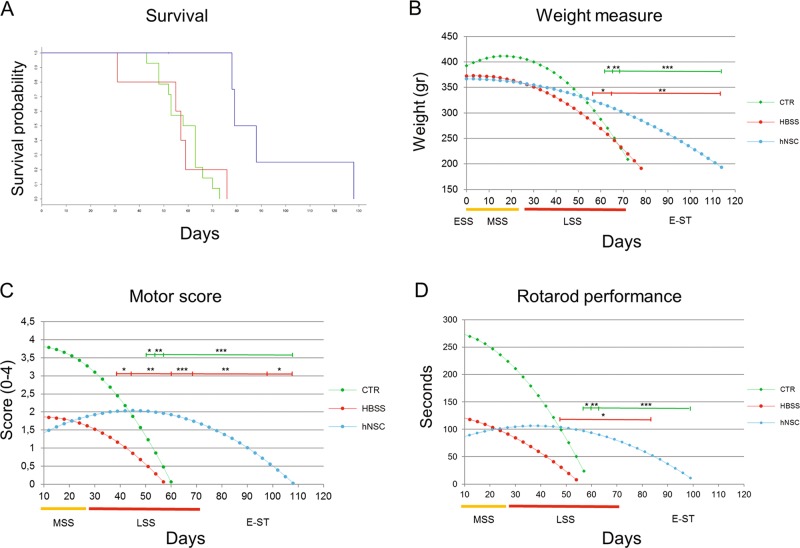
Fig. 3. Extention of lifespan and slow-down of behavioral deterioration in hNSCs-treated rats.
a Kaplan–Meier survival probability analysis, n = 14 for untreated SOD1 (CTRL, green) and n = 5 for HBSS-treated SOD1 (HBSS, red) and hNSCs-treated SOD1 (hNSCs, blue). b–d Trend of weight, motor score and rotarod performance decline in CTRL (green, n = 22), HBSS (red, n = 15) and hNSCs (blue, n = 15) rats. The curves were obtained by appliyng statistical modelling of the progressive reduction of the mean weight value (b) or mean motor score value (c) or the mean time spent on the rotarod (d). Where the hNSCs-treated animals showed a statistically significant improved value respect to CTRL is indicated with asterisks above the green line, respect to HBSS animals with asterisks above the red line. On the x axis, the days are shown after ESS and coloured bars indicate the stage of the disease. *p ≤ 0,05; **p ≤ 0,01; ***p ≤ 0,001. Data are reported as mean ± SEM

