
Figure 2.
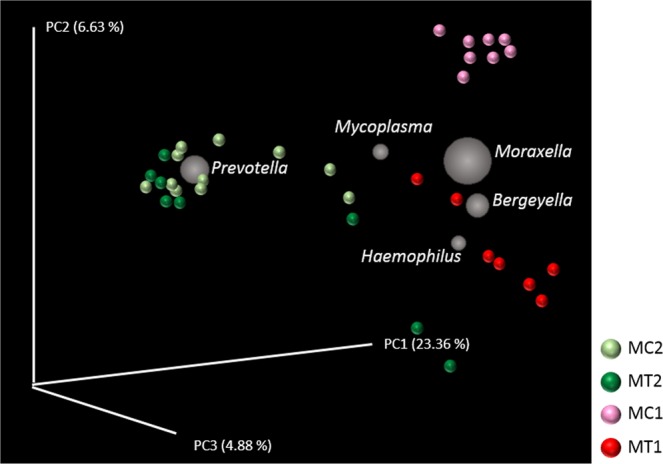
Principal Component Plots (jackknifed) representing beta diversity on rarefied samples. Beta diversity of nasal samples of piglets was computed through unweighted UniFrac analysis for both farms, MT and MC, in two different sampling times, before (1) and after (2) elimination of perinatal antibiotic treatment. The biplot shows grey spheres corresponding to the five most abundant genera visualized in the PCA space. The size of the spheres is proportional to their relative abundance across all the samples.