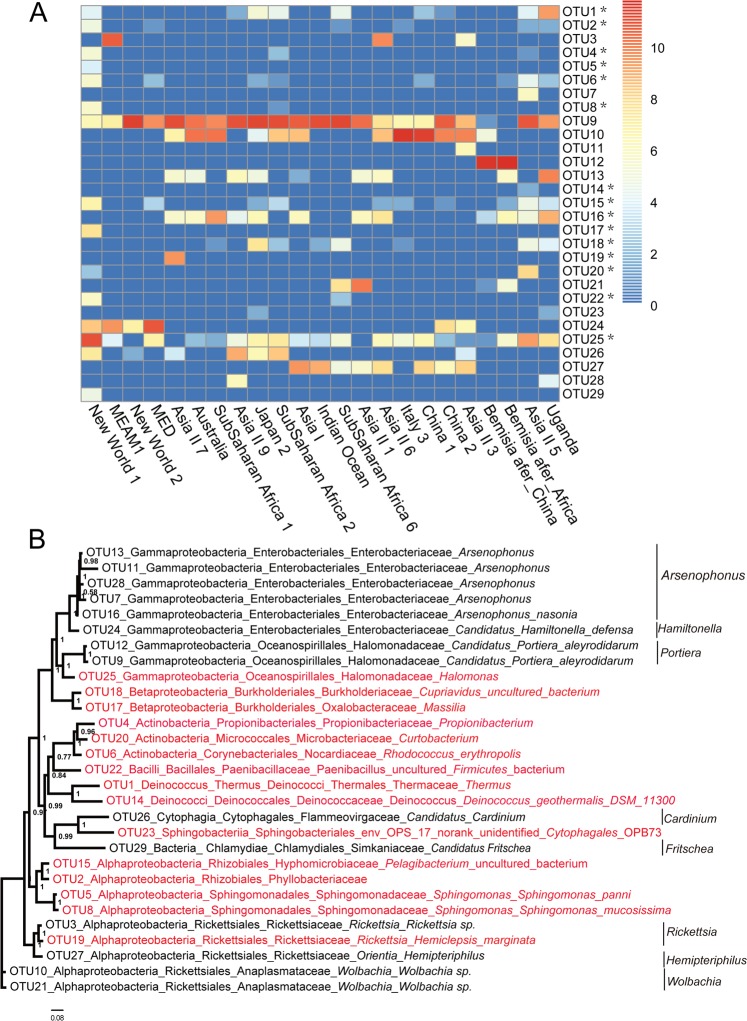
Figure 1.
OTU profiles of the samples and phylogenetic analysis of all OTUs. (A) Heat map of OTU profiles (y-axis) inferred from PacBio. The x-axis shows 23 samples. The number of reads per OTU was normalized by total number of reads from the sample. For each sample, the number of reads per OTU represents total number of reads (the number of reads were transformed to log 2) from the sample. The asterisk denoted OTUs show the new OTUs found in this study. (B) The Bayesian unrooted phylogenetic tree of representative sequences OTUs. Red text labels represent the new OTUs. The scale bar at the base indicates number of substitutions per site.

