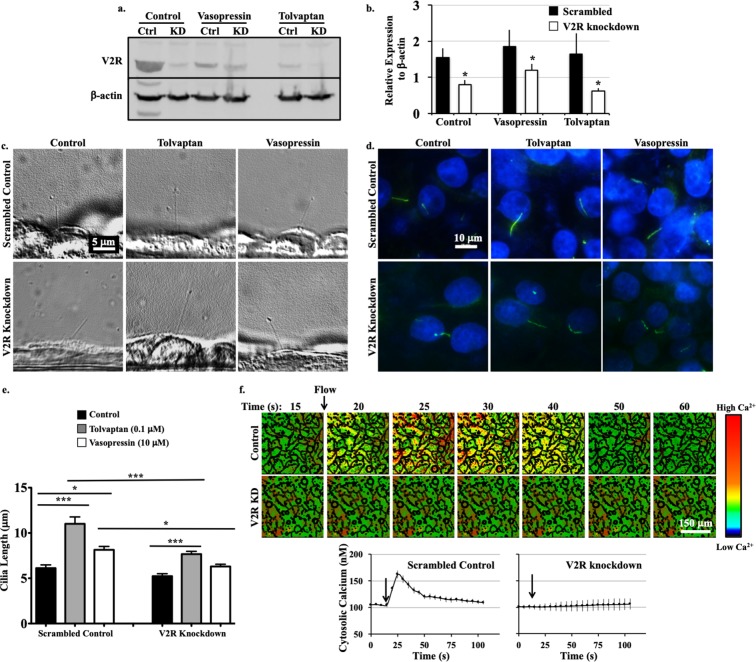
Figure 2.
V2R modulates ciliary length and function. (a) Representative western blot image of scrambled control (Ctrl) and V2R-knockdown (KD) cells with vehicle (control), vasopressin (10 μM) and tolvaptan (0.1 μM) treatments. (b) Normalized V2R expression level is shown. Changes in ciliary length are observed from the phase contrast (side view, c) and immunostaining (top view, d) images. (e) Ciliary lengths are averaged. (f) Time-lapse images represent intracellular calcium level in response to fluid-shear stress. Color bar indicates intracellular calcium level from low (black) to high (red). Averaged intracellular calcium levels are plotted across time in second (s). Arrows indicate the start of fluid-shear stress. Corresponding brightfield images are shown in Supplementary Fig. S2. N = 3 experiments for each group. For each N, a minimum of 50 cells were analyzed. *P < 0.05, **P < 0.001, and ***P < 0.0001 compared to the corresponding control groups.

