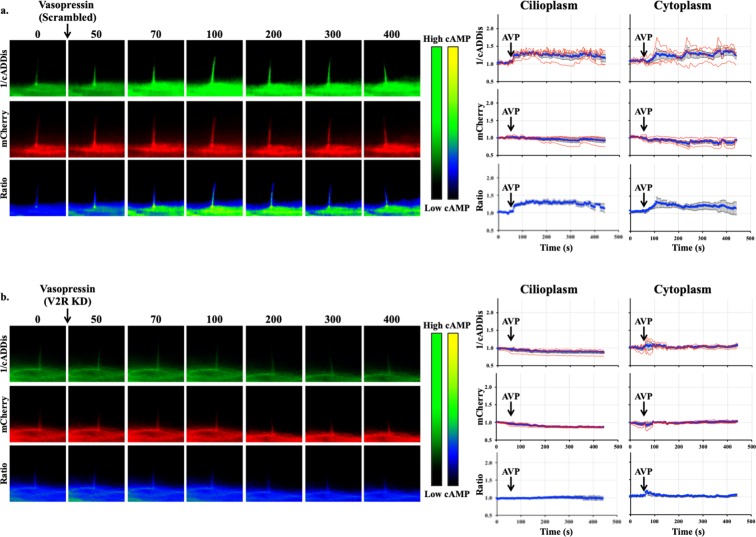
Figure 5.
Vasopressin mediates cAMP signaling in cilia. Representative time-lapse images of 1/cADDis, mCherry channels and Ratio (mCherry/cADDis) with their corresponding line graphs showing cAMP levels in response to vasopressin (AVP) in (a) scrambled and (b) V2R-knockdown cells. Color bar on the left indicates cAMP level from low (black) to high (green) for 1/cADDis channel. cAMP level from low (black) to high (yellow) are shown on the right color bar for the ratio images. Corresponding individual raw traces (red) and average signal (blue) are plotted in line graphs for 1/cADDis, mCherry and ratio signals in the cilioplasm and cytoplasm. Arrows indicate stimuli. N = 4 for each group.

