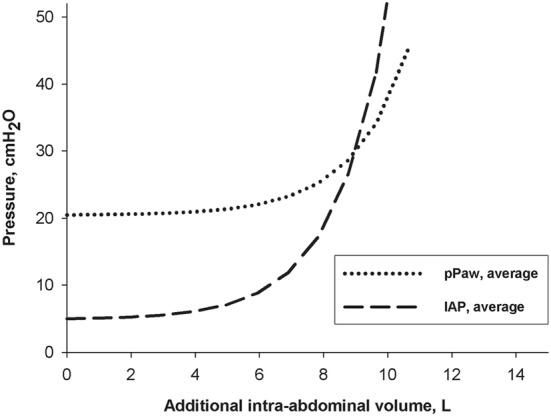
Fig. 3.

Exponential pressure–volume curves of intra-abdominal pressure (IAP) (dashed curve) and peak airway pressure (pPAW) (dotted curve) in centimetre of water in function of increasing additional intra-abdominal volume in litres derived from 7 pigs.
Figure reproduced with permission from Regli et al. [26]
