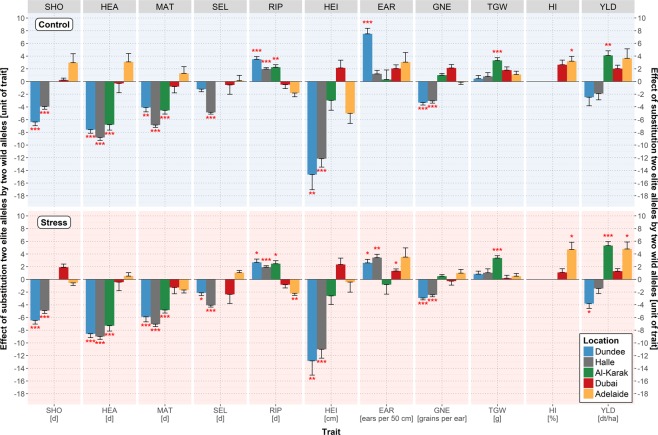
Figure 3.
Estimates of Ppd-H1 wild allele effects on plant developmental and yield-related traits. The trait names are given in the grey rectangles above each subplot and at the bottom where, in addition, the units of the traits are indicated. Trait abbreviations are listed in Supplementary Table S3. The color of the bars represents the location, blue for Dundee, grey for Halle, green for Al-Karak, red for Dubai and yellow for Adelaide. Ppd-H1 wild allele effects under control and stress treatments are depicted with a bright blue (top) and a bright red background (bottom), respectively. Statistically significant wild allele effects are indicated by red asterisks above or below the bars with *P < 0.05, **P < 0.01, ***P < 0.001. The height of the bars indicates the size of the Ppd-H1 wild allele effect, obtained by calculating the difference between the mean performances of HEB-YIELD lines carrying two wild alleles versus two elite alleles.

