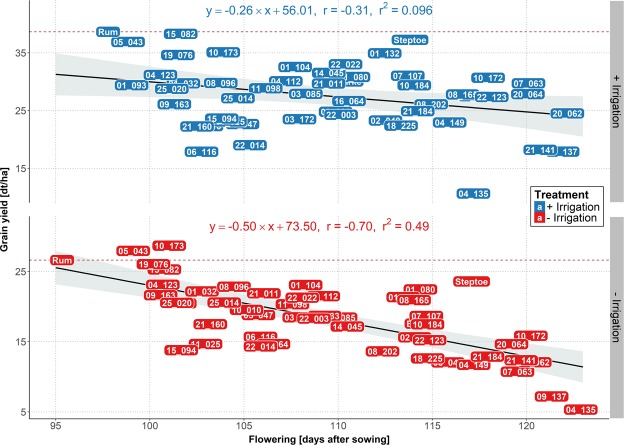
Figure 5.
Regression of grain yield on flowering in Al-Karak. The yield levels of the 48 HEB-YIELD lines plus checks are depicted as a function of flowering time, separately for control (blue labels) and stress (red labels) treatments. The yield level of the local check cultivar ‘Rum’ is indicated by a dashed red line. On top of each subplot the linear regression equation, the Pearson’s correlation coefficient (r) and the coefficient of determination (r2) are indicated.

