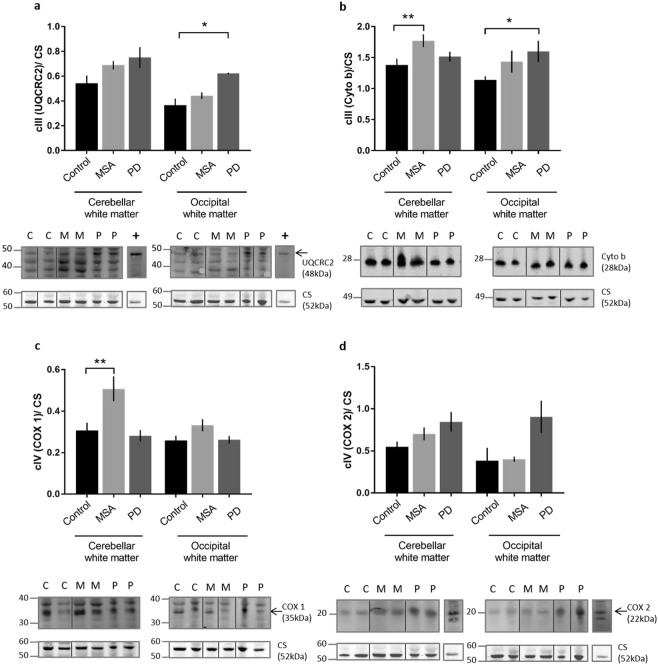
Figure 3.
Complex III and IV subunit expression in MSA and PD. Western blotting of two subunits from complex III and from complex IV were performed in all groups. A representative western blot is shown below each bar graph. Each band chosen originates from the same gel. The only significant change seen in the UQCRC2 subunit of complex III was in PD occipital white matter (a). Whereas cytochrome c, another complex III subunit not only showed an increase in PD occipital white matter but also in MSA white matter (b). When the two core subunits of cytochrome c oxidase (complex IV) were visualised, only COX 1 showed significant changes. An upregulation in protein expression was observed in the cerebellar white matter of MSA cases (c). The protein levels of COX 2 subunit remained uniform in all groups and brain regions (d). Immunoblot abbreviations (C = control, M = MSA, P = PD, + = positive control, human heart lysate). Significance was set at p < 0.05 (*), p < 0.01 (**) and p < 0.001 (***). Full length gels are demonstrated in the Supplementary Figs 2, 4 and 7.

