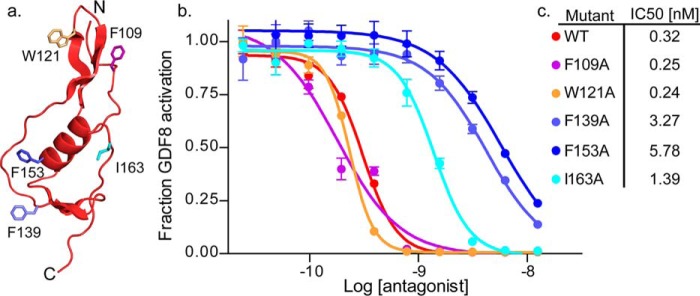
Figure 5.
Full-length WFIKKN2 mutant selection and inhibition. a, ribbon diagram of WFIKKN2 FSD; labeled sticks represent residues mutated to alanine and colored based on the inhibition curve. b, IC50 curves generated via luciferase assay with increasing amounts of WFIKKN2 mutants titrated against a constant concentration of GDF8. c, IC50 values of mutants tested in b and depicted on the WFIKKN2 FSD structure in a. Error bars, S.D.

