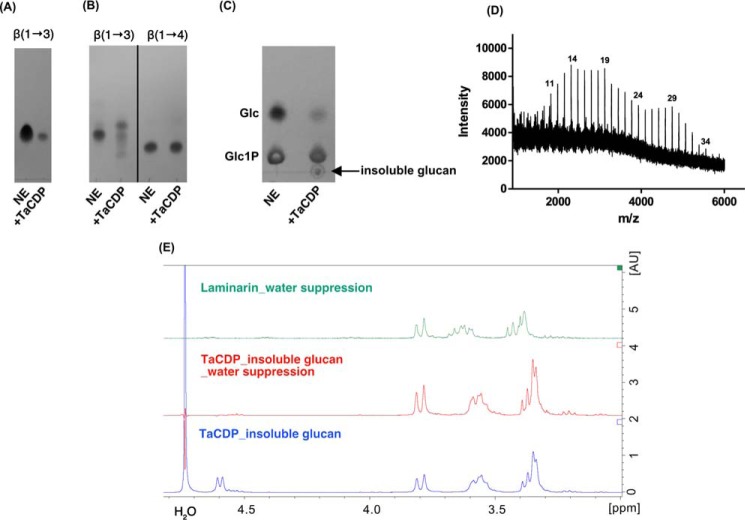
Figure 6.
Characterization of TaCDP. A, TLC analysis of the phosphorolysis reaction carried out by TaCDP in the presence of 20 mm laminaribiose and 10 mm Pi; B, TLC analysis of the phosphorolysis reaction carried out by TaCDP in the presence of 20 mm laminaritriose [β-(1→3)] or cellotriose [β-(1→4)] and 10 mm Pi. All enzymatic reactions in A and B were performed at 37 °C for 12 h in 100 mm HEPES, pH 7.2. NE, no enzyme control. C, glycan synthetic reaction in the presence of Glc (10 mm) and Glc1P (50 mm) in 250 mm HEPES, pH 7.2, incubated at 37 °C for 4 days. D, MALDI-TOF analysis of the insoluble glucan product from C. The corresponding DPs of the glucan product are indicated at the top of the peaks. E, 1H NMR analysis (400 MHz, 25 °C) of the insoluble product from C. The insoluble glucan was washed three times with D2O, freeze-dried, and redissolved in 1 m NaOD prior to the analysis. 1H NMR analysis of the insoluble product (blue) shows a doublet centered at 4.6 ppm, indicating the signal of the axial H-1 protons of the internal β-(1→3)-linkages. The doublet disappeared on 1H NMR of the same sample under water suppression (red). The 1H NMR spectrum of laminarin (β-(1→3)-glucan) standard recorded under water suppression is included for comparison (green).

