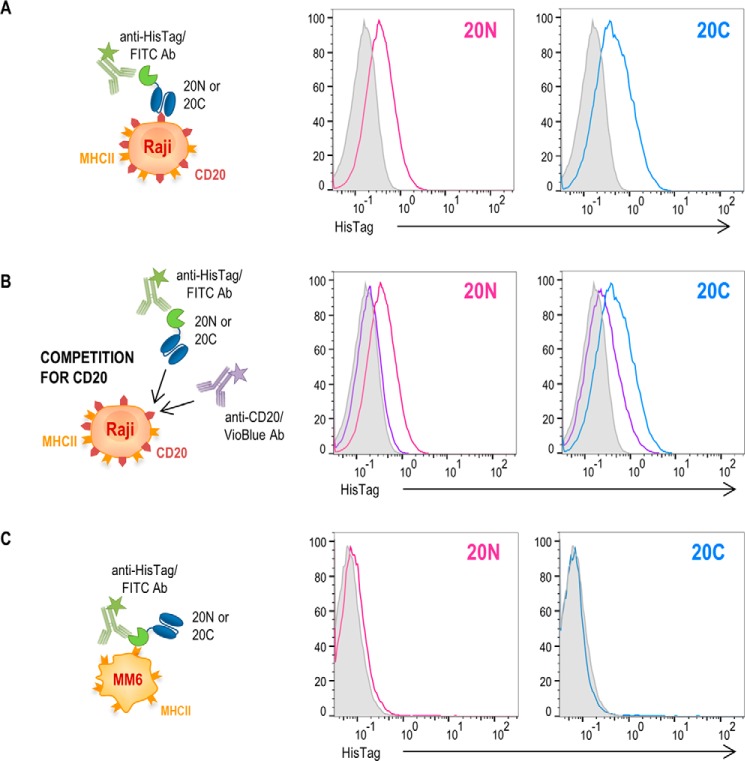
Figure 6.
Target cell binding of split SEA2/scFv-CD20 fusion proteins. A and C, binding assays. Histograms demonstrate surface binding of the indicated fusion proteins at concentration of 200 nm, either scFv–CD20/nSEA2 (20N) and scFv–CD20/cSEA2 (20C), respectively, on target cells Raji (A) or Mono-Mac-6 (C). B, the binding of both fusion proteins, 20N and 20C, respectively, at 200 nm concentration was analyzed on Raji cells in the presence (purple curves) or absence (magenta and blue curves) of anti-CD20/VioBlue for competition. The shaded curves show the target cells stained only with anti-HisTag/FITC.

