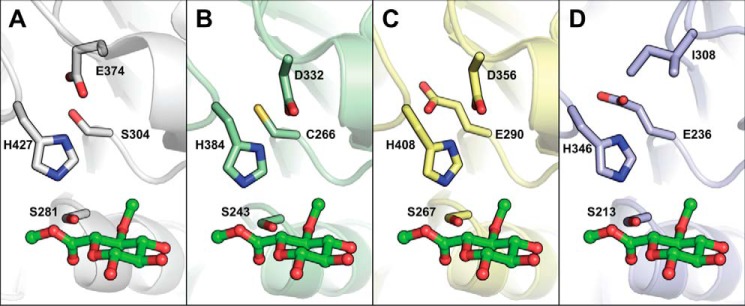
Figure 3.
Comparison of catalytic residues among selected structurally characterized CE15 members. The TtCE15A (A), MZ0003 (B; PDB code 6ehn), OtCE15A (C; PDB code 6gs0), and StGE2 (D; PDB code 4g4g) are shown in gray, green, yellow, and blue, respectively. The enzymes are shown relative to the methyl ester of 4-O-methyl glucuronoate substrate shown as green sticks, generated from structural alignment with the complex structure of StGE2 (PDB code 4g4j). The catalytic residues and equivalently placed residues are shown in sticks. Notably, the canonical acidic residue observed in StGE2 is absent in TtCE15A and MZ0003, and instead the acidic residue is found on a different loop, and in OtCE15A, acidic residues are found in both positions.

