
Figure 4.
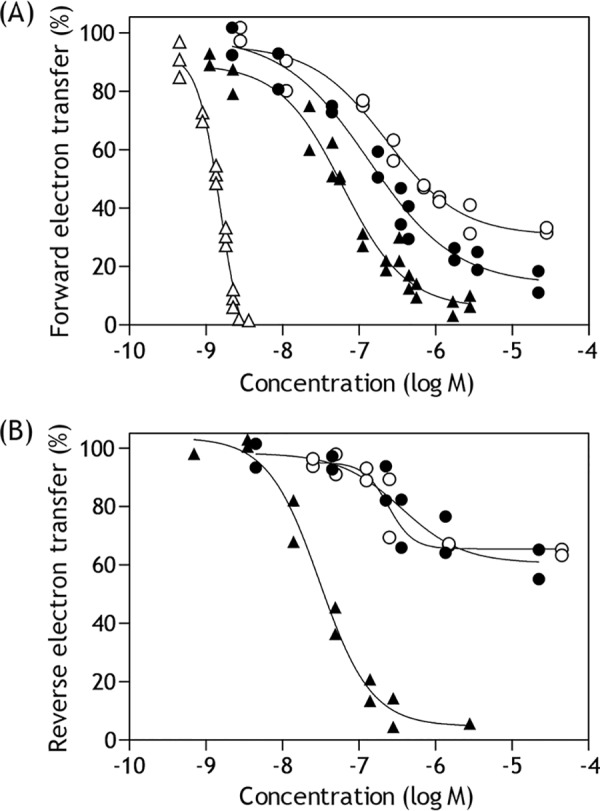
Dose-response curves for the inhibition of electron transfer in complex I. A, the inhibition of NADH oxidase activity by S1QELs. The reaction was initiated by adding NADH (final concentration: 50 μm) after incubation of SMPs with each test compound for 4 min at 30 °C. S1QEL2.1, closed circles; S1QEL2.3, open circles; S1QEL1.1, closed triangles; bullatacin, open triangles. The final mitochondrial protein concentration was 30 μg/ml. B, the inhibition of reverse electron transfer by S1QELs. The reaction was initiated by adding ATP (final concentration: 1.0 mm) after incubation of SMPs with each compound for 4 min at 30 °C. S1QEL1.5, closed circles; S1QEL1.5_D1, open circles; S1QEL1.1, closed triangles. The final mitochondrial protein concentration was 100 μg/ml.