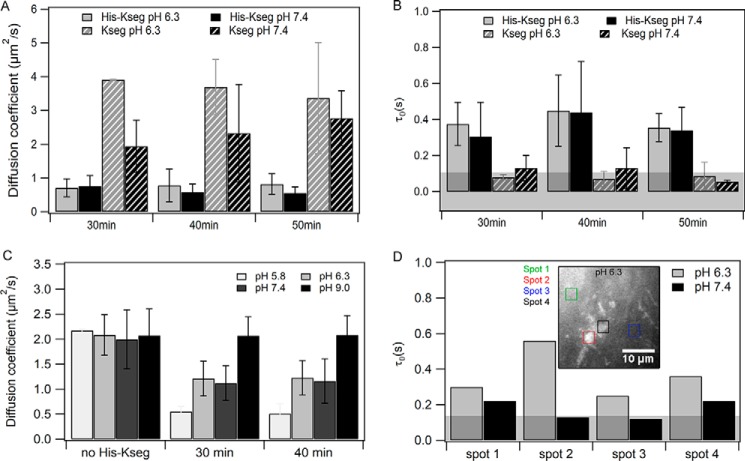
Figure 2.
Comparison of the diffusion of K-segment and His–K-segment on DOPC:DOPS (4:1) bilayer at pH 6.3 and 7.4. The protein–to–lipid ratio used was 1:130. A, diffusion coefficient (D) of fluorescently labeled K-segment/HH on DOPC:DOPS (4:1) bilayer. B, diffusion law intercept (τ0) of fluorescently labeled K-segment/HH on the membrane. C, diffusion coefficient of membrane lipids bound to the peptide. Error bars for A–C are given as S.D. calculated from three independent experiments. D, diffusion law intercept (τ0) of fluorescently labeled His–K-segment on the membrane at different spots (one representative set). Inset is the image of the DOPC:DOPS (4:1) membrane bound with rhodamine-labeled with His–K-segment at pH 6.3. Those spots are marked for which τ0 values are reported. For representative raw data (images, ACF, and diffusion law plots) see Fig. S4.

