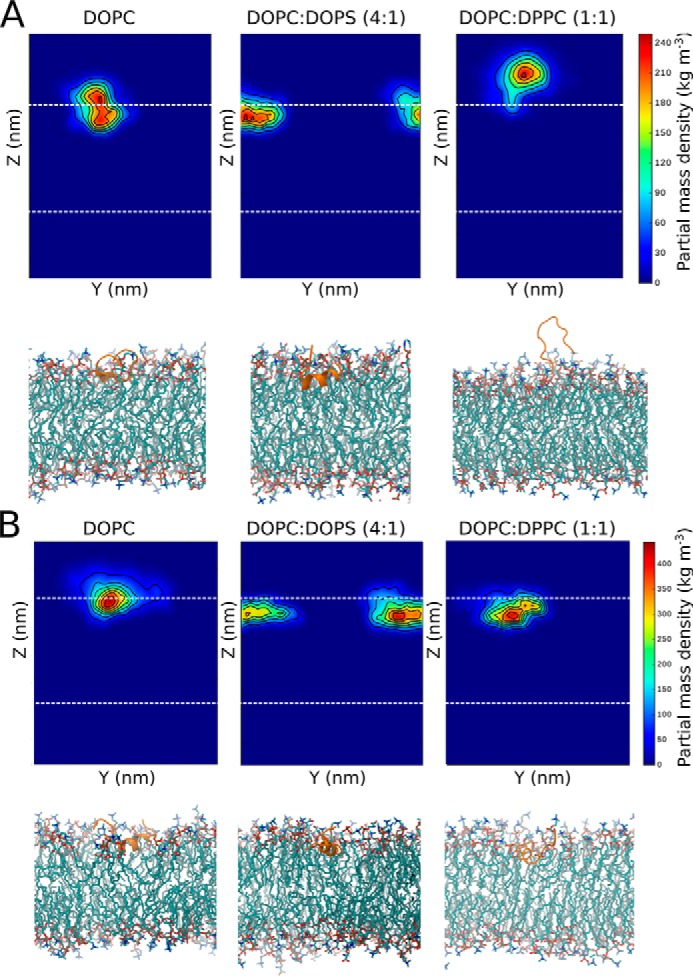
Figure 4.

Peptide–membrane interactions during simulations at pH 4. A, K-segment, and B, His–K-segment. Each panel corresponds to a particular membrane system: DOPC, DOPC:DOPS (4:1), or DOPC:DPPC (1:1). At the top of each panel, the final 0.2-μs averaged partial mass density of the peptide is shown (with respect to Z-normal and y axis), with the outer leaflet phosphates indicated by a dashed line. The final snapshot of the simulation is shown at the bottom of each panel (peptide shown in cartoon representation in orange, lipids shown in licorice representation, with carbons colored cyan, oxygens red, and nitrogens blue).
