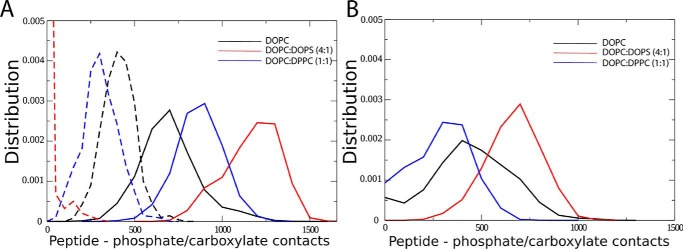
Figure 7.
Interactions of individual K-segment and His–K-segment with lipid bilayers. A, distribution of the number of contacts between peptide and lipid phosphate or anionic lipid carboxylate groups (0.6 nm cutoff) are shown for the His–K-segment at acidic pH (data shown in solid format) and basic pH (data shown in dashed format). B, distribution of the number of contacts between peptide and lipid phosphate or anionic lipid carboxylate groups (0.6 nm cutoff) are shown for the K-segment at acidic pH.

