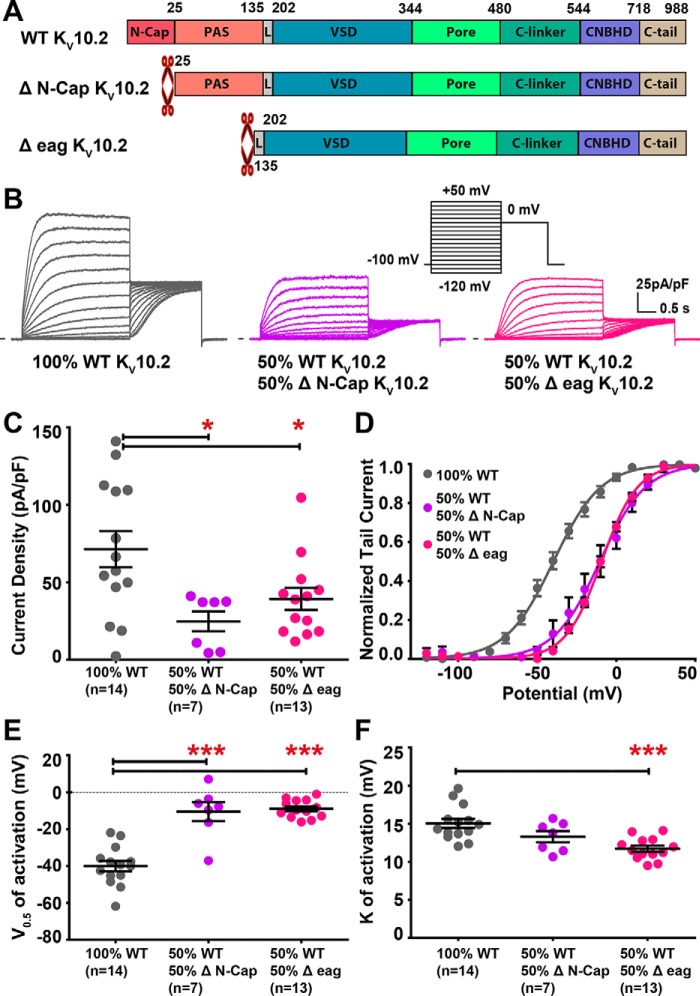
Figure 11.
Co-expression of WT and truncated KV10.2 channels uncovers a right shift in the activation curve, as compared with WT channel. A, domain organization of WT and truncated channels. B, representative, superimposed recordings of COS-7 cells transfected with WT KV10.2 channel (left), WT and ΔN-Cap KV10.2 (middle), and WT and Δeag KV10.2 (right). Inset, activation voltage protocol used (one sweep every 8 s). C, mean ± S.E. KV10.2 maximum tail-current density, in the indicated conditions. *, p < 0.05 versus WT, Mann-Whitney test. D, activation curve in the indicated conditions. E, mean ± S.E. half-activation potential (V0.5). ***, p < 0.001 versus WT, Student's t test. F, mean ± S.E. activation slope (k). ***, p < 0.001 versus WT, Student's t test.

