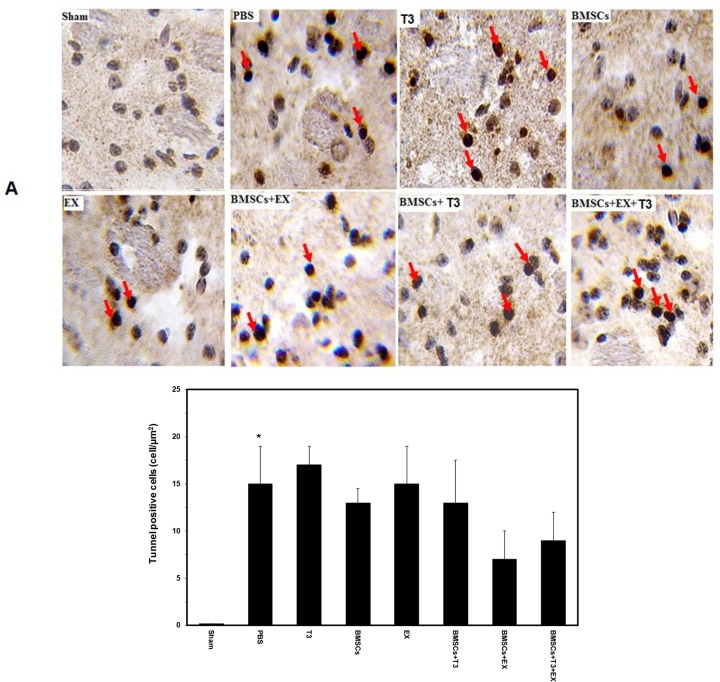
Figure 3.
Apoptotic cells in different groups
TUNEL staining image (A) and quantitative analysis of number of TUNEL-positive cells (B) in the sham-operated, PBS (control), BMSCs, EX, T3, BMSCs+T3, BMSCs+EX and BMSCs+EX+T3 groups, seven days after MCAO in mice. The number of TUNEL-positive cells (brown) was visualized using a Reichert microscope with a 40× magnification. Values are presented as Mean±SEM.

