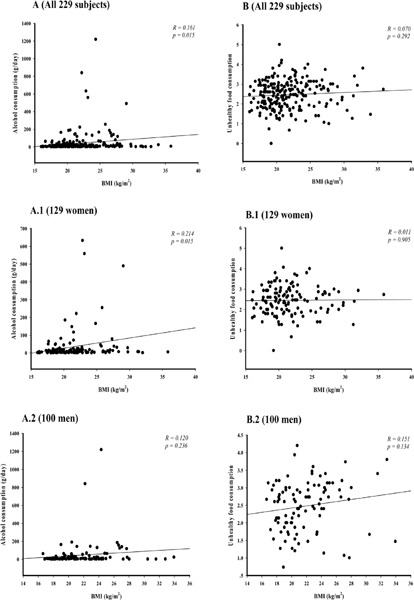
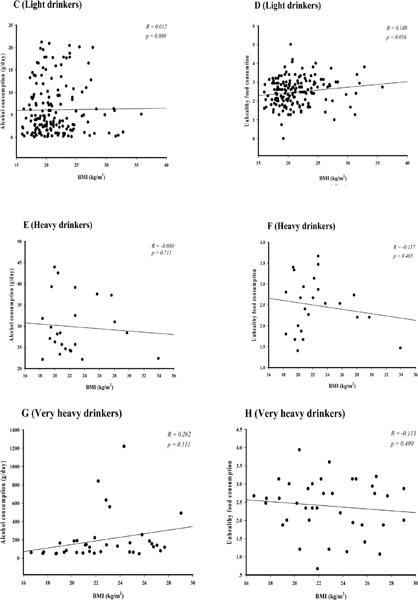
Figure 1.


Correlation lines of Pearson’s correlations (R) between alcohol consumption and unhealthy food consumption with BMI in subjects who consumed alcohol. N = 229; p < 0.05, significant differences; light drinkers: <22 g ethanol/day; heavy drinkers: ≥22 and <44 g ethanol/day; very heavy drinkers: ≥44 g ethanol/day.
