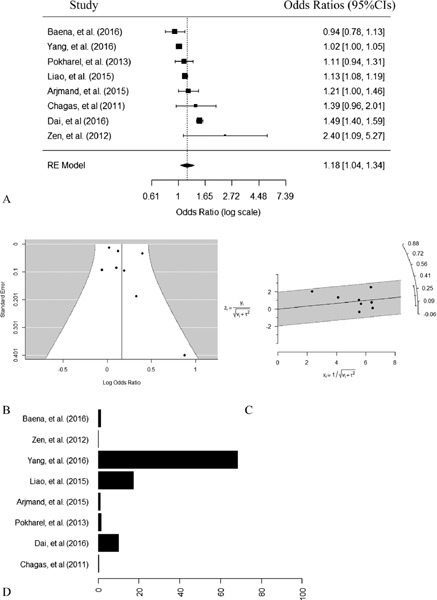
Figure 2.

Meta-analysis of neck circumference associated with coronary heart disease (random effects model). (A) Forest plot. (B) Funnel plot. The X-axis was log odds ratio, and the Y-axis represents the standard error. No publication bias was found using regression test for funnel plot asymmetry (p = 0.1574). (C) Radial plot. x stands for the inverse of the standard errors, y stands for the outcome, z stands for standardized outcome, both v and τ stand for standard errors with v denoting the standard errors from the fixed effects part and τ denoting the standard errors from the random effects part. (D) Contribution plot.
