
Figure 4.
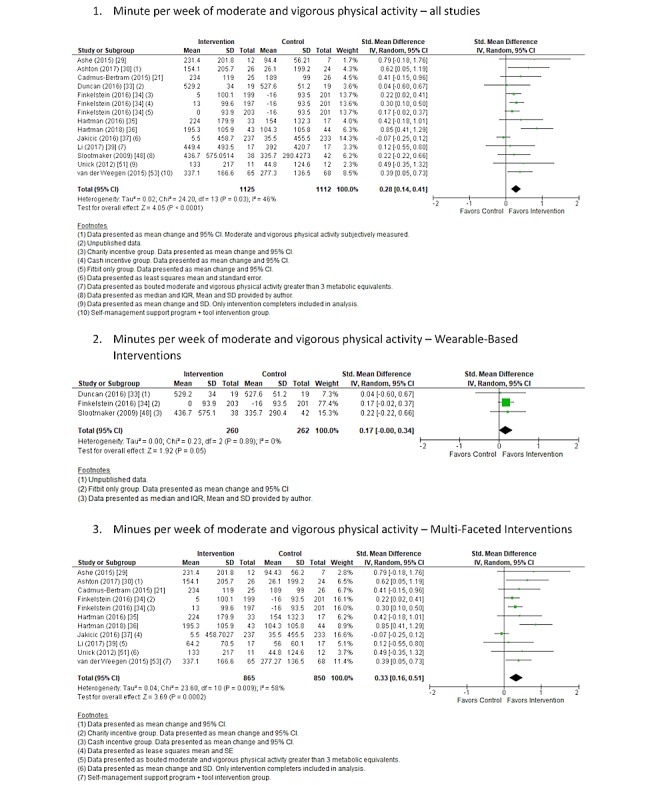
Forest plot of standardized mean difference of time spent in moderate and vigorous physical activity per week in studies comparing an intervention that included a consumer-based wearable activity tracker with a control group that did not utilize a consumer-based wearable activity tracker. Subgroup analysis was completed on studies that included wearable-based interventions compared with control and multifaceted interventions compared with control. Green square indicates the standardized mean difference for each individual study. Black square indicates the overall standardized mean difference for all studies.