
Figure 5.
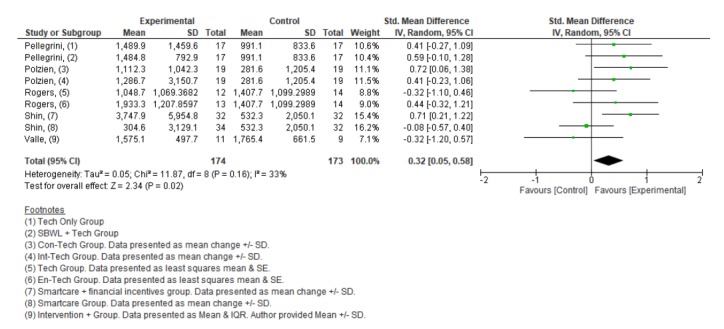
Forest plot of standardized mean difference of energy expenditure in studies comparing an intervention that included a consumer-based wearable activity tracker with a control group that did not utilize a consumer-based wearable activity tracker. Green square indicates the standardized mean difference for each individual study. Black square indicates the overall standardized mean difference for all studies.