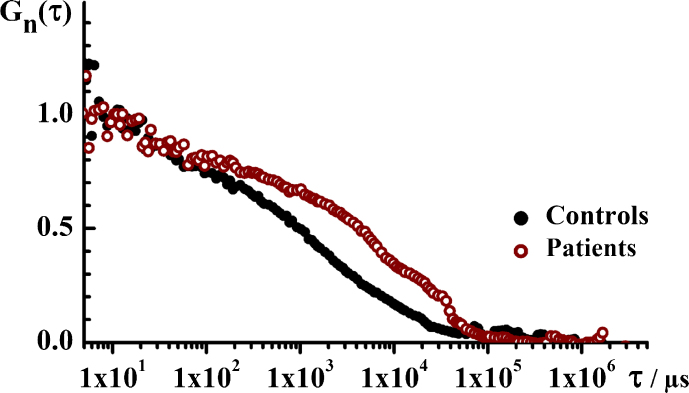
Fig.5.
The translational diffusion time, i.e., the size of ThT-active structured amyloidogenic oligomeric aggregates in the patient and in the control group. Temporal autocorrelation curves (tACCs) for the control (black) and the patient (wine) groups showing that the characteristic decay time is longer for the patient group, indicating that the structured aggregates observed in this group are larger. Of note, only time series where single events were observed are analyzed.

