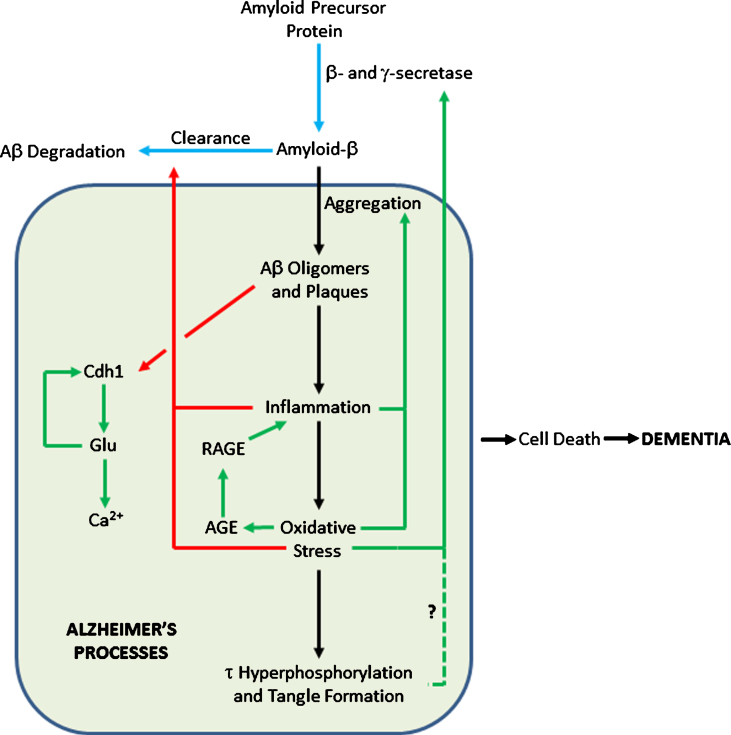
Fig.2.
Feedback Loops in the Amyloid Cascade. Blue arrows show pathways in healthy cells; black arrows show AD pathways; pathways activated in AD are in green; pathways inhibited in AD are in red. The dashed line shows a tentative connection from hyperphosphorylated τ to increased AβPP processing to Aβ.

