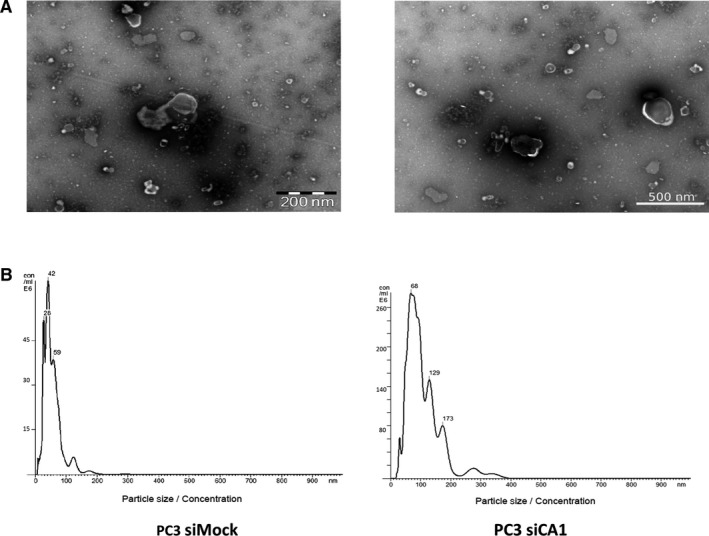
Figure 2.

Characterization of PC3 silencing of carbonic anhydrase I (siCA1) and PC3 siMock isolated exosomes (A) Representative transmission electron microscopy (TEM) images. Five microlitres of PC3 siCA1 and PC3 siMock exosomes were placed on a carbon/formvar grid, negatively stained with 1% ammonium molybdate + 0.1% trehalose and examined with a FEI Morgagni transmission electron microscope operating at 80 kV. Scale bar: 200; 500 nm. (B) Representative nanoparticle tracking analysis (NTA) of isolated exosomes. Isolated exosomes were diluted to a suitable concentration with phosphate‐buffered saline (PBS) (1800x; siCA1 as well as control siMock), and the size distribution was analysed by NTA using a NanoSight NS500 (for each sample 3 × 60 second runs; for error bars indicating ±standard error of the mean/mode and final nanoparticle concentration see Figure 3)
