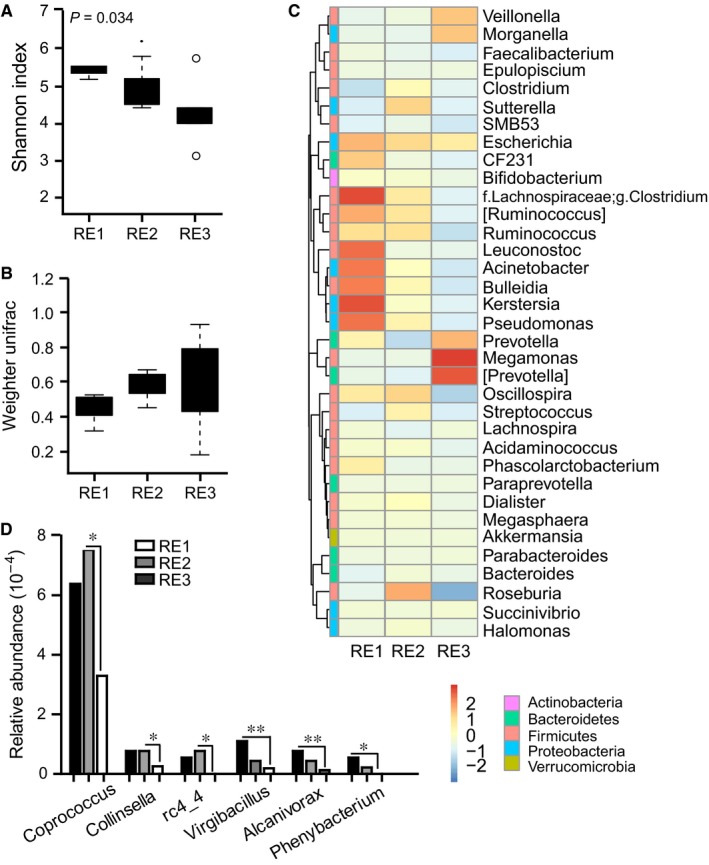
Figure 5.

Faecal microbiota is associated with disease severity of RE. (A) Differences in α‐diversity in patients with mild to severe RE as indicated by Shannon index. (B) Differences in β‐diversity as indicated by weighted Unifrac analysis of the distance matrix. (C) Heatmap showing abundance distribution of the OTUs identified as key variables among patients with mild to severe RE. (D) Metastat analysis showing the relative abundances of the significant six bacteria at the genus level in patients with mild to severe RE
