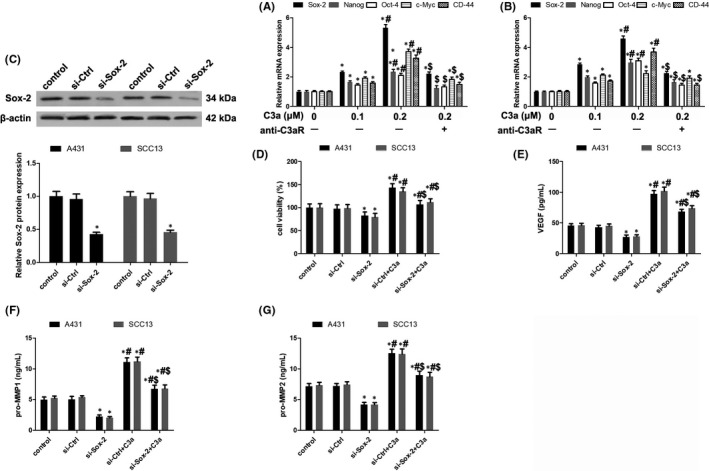
Figure 3.

The involvement of Sox‐2 in C3a functioning. (A, B) Expression analysis of stemness factors including Sox‐2, Nanog, Oct‐4, c‐Myc and CD‐44 in A431 and SCC13 cells. n = 4. *P < 0.05 vs 0 μmol/L C3a, #P < 0.05 vs 0.1 μmol/L C3a, $P < 0.05 vs 0.2 μmol/L C3a. (C) Knockdown of Sox‐2 expression in A431 and SCC13 cells. n = 4. *P < 0.05 vs control. (D) Evaluation of cell viabilities after Sox‐2 knockdown with or without C3a exposure. n = 5. *P < 0.05 vs control, #P < 0.05 vs si‐Sox‐2, $P < 0.05 vs si‐Ctrl+C3a. (E) Detection of VEGF secretion by ELISA assay after Sox‐2 knockdown with or without C3a exposure. n = 5. *P < 0.05 vs control, #P < 0.05 vs si‐Sox‐2, $P < 0.05 vs si‐Ctrl+C3a. (F) Detection of pro‐MMP1 secretion by ELISA assay. n = 5. *P < 0.05 vs control, #P < 0.05 vs si‐Sox‐2, $P < 0.05 vs si‐Ctrl+C3a. (G) Detection of pro‐MMP2 secretion by ELISA assay. n = 5. *P < 0.05 vs control, #P < 0.05 vs si‐Sox‐2, $P < 0.05 vs si‐Ctrl+C3a
