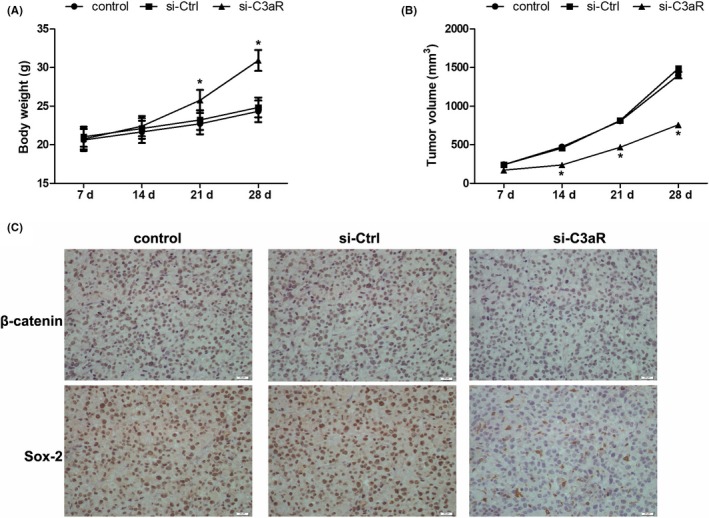
Figure 6.

The effect of C3 on cSCC cell growth in mouse model. (A) C3aR was knocked down in A431 cells and then subcutaneously implanted into nude mice. Body weights were measured every week since the implantation. n = 5‐6. *P < 0.05 vs control. (B) Tumour volumes were measured by caliper and calculated using the formula V = (length × width2)/2. n = 5‐6. *P < 0.05 vs control. (C) At 4 weeks after the implantation, xenografts were harvested and the expression of β‐catenin and Sox‐2 was detected by immunohistochemistry. Scale bar = 20 μm. n = 5‐6
