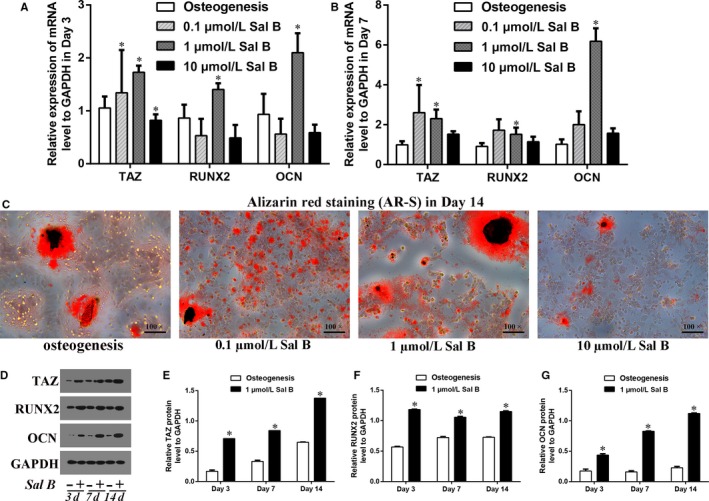
Figure 2.

Sal B facilitated osteogenic differentiation and increased the TAZ expression in MC3T3‐E1 cells. (A) The relative expression of the TAZ, RUNX2 and OCN mRNA levels to GAPDH were presented in Day 3 and (B) in Day 7 after the induction of osteogenic medium in the absence or presence of Sal B at different concentrations (0.1 μmol/L, 1 μmol/L and 10 μmol/L Sal B). (C) The alizarin red staining (AR‐S) reflected that the calcium droplets in Day 14 after the treatment. (D) The relative protein levels of TAZ, RUNX2 and OCN to GAPDH were presented in Day 3, in Day 7 and in Day 14 after the treatment. (E‐G) Bar graphs showed the means ± SD of the relative protein levels of TAZ, RUNX2 and OCN to GAPDH from 3 independent experiments. (n = 3) *P < 0.05 vs the control group (cells cultured in osteogenic medium without Sal B)
