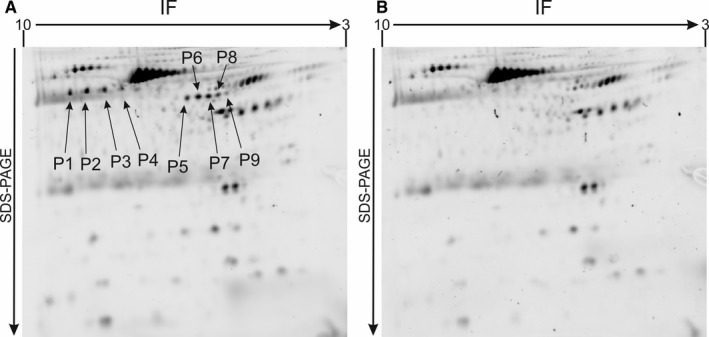
Figure 1.

High‐resolution 2D‐DIGE electrophoretic patterns of blood platelet proteome obtained from SPMS patients (A), and the control group (B). Proteins were separated using isoelectric focusing (pH range 3‐10, 7 cm), and 12.5% SDS‐PAGE gels. This is a representative image of the 2D analysis. Spots highlighted as P1‐P9 have increased expression in SPMS platelets in comparison to the control group, and were selected for mass spectrometry analysis
