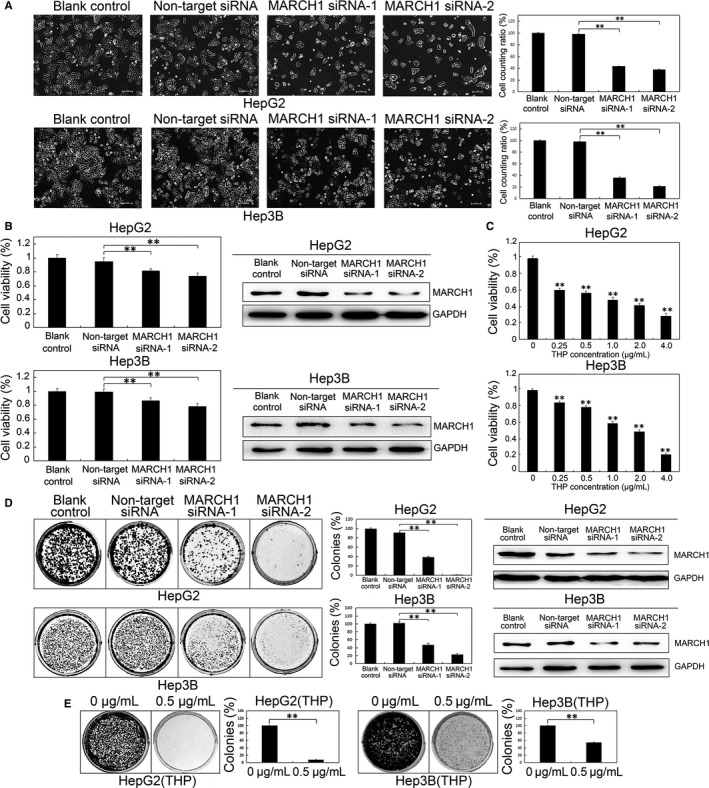
Figure 2.

Down‐regulated MARCH1 inhibited human HCC cell proliferation. A, Representative microscope images of the HepG2 and Hep3B cells of MARCH1 siRNA interference for 48 h. B, The cell viability of the HepG2 and Hep3B cells transfected with MARCH1 siRNA (MARCH1 siRNA‐1 and MARCH1 siRNA‐2) and negative siRNA (non‐target siRNA) at 48 h post‐transfection is presented as a per cent of the cell viability attained by the non‐transfected cells (blank control). Western blotting assay was used to confirm the MARCH1 down‐regulation by siRNA. C, The cell viability of the HepG2 and Hep3B cells treated by THP in different concentrations for 24 h and 48 h, respectively, was assayed using a CCK‐8 cell proliferation assay,0 μg/mL was used as compared groups. D, Colony formation assay of transfected HepG2 and Hep3B cells. 5000 cells were seeded in 6‐well plates and grown for over 12 days. The colonies were stained with crystal violet solution, photographed and counted. The down‐regulation of the MARCH1 protein levels of colonies by siRNA for 6 d was confirmed by Western blot analysis. E, The colony formation assay of the HepG2 and Hep3B cells treated with THP. All the data in this figure are represented as mean ± SD. **P < 0.01
