Figure 3.

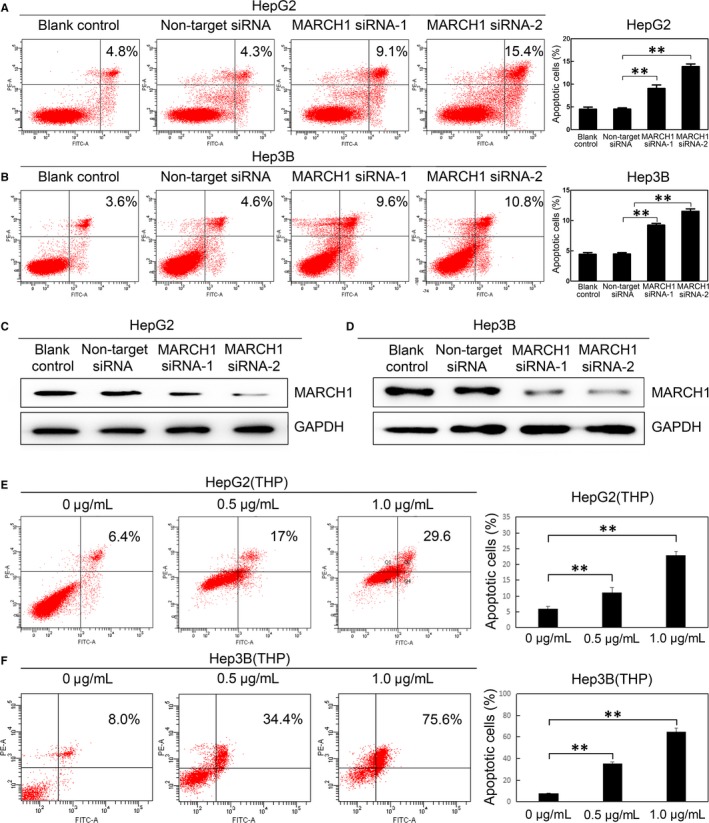
Down‐regulated MARCH1 induced human HCC cell apoptosis. A and B, The cell apoptosis ratio of the HepG2 and Hep3B cells transfected with the two sets of MARCH1 siRNA, negative siRNA and non‐transfected for 48 h, respectively. C and D, Western blotting assay was used to confirm the MARCH1 down‐regulation by siRNA. E and F, Cell apoptosis ratio of the HepG2 and Hep3B cells treated with THP in different concentrations for 24 h and 48 h, respectively. All the data in this figure are represented as mean ± SD. ** P < 0.01
