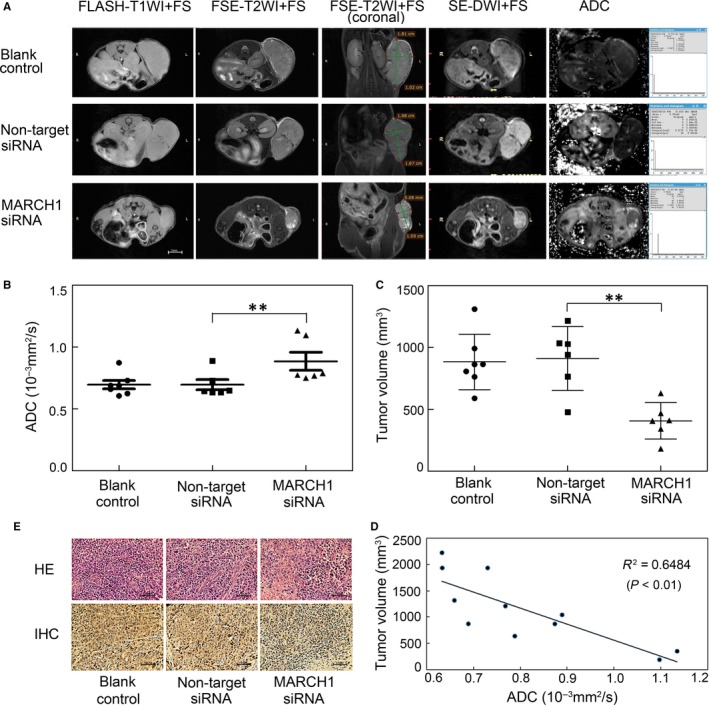
Figure 7.

Magnetic resonance imaging (MRI), hematoxylin and eosin (H–E) and IHC of human HCC tumours. A, T1‐weighted MRIs, axial and coronal T2‐weighted MRIs, diffusion‐weighted MRIs and apparent diffusion coefficient (ADC) maps of the PBS‐treated, negative siRNA‐treated and MARCH1 siRNA‐treated tumours. B, Average tumour ADC in the PBS‐treated, negative siRNA‐treated, and MARCH1 siRNA‐treated tumours. C, Average tumour volume acquired on the coronal T2WI in the PBS‐treated, negative siRNA‐treated and MARCH1 siRNA‐treated tumours. D, Positive correlation between the ADC value and tumour volume. E, H–E histology and MARCH1 IHC in the PBS‐treated, negative siRNA‐treated and MARCH1 siRNA‐treated tumour tissue. All the data in this figure are represented as mean ± SD. **P < 0.01
